I have been to the Data Conference this April in Moscow. It lasted for 2 days, and I can honestly say I heard A LOT of unfamiliar words.
I’m not going to unpack it all here, but I’d like to highlight a few things that struck me as meaningful.
What Makes a Good Data Scientist?
Here are a few insights I wrote down during the talks:
- Read the literature. Be aware, so to speak.
- Simplify until it can’t be simplified anymore. If you can explain it simply, you understand it.
- Modify how you solve problems. Be flexible, not formulaic. Try out and adjust.
- Discuss. New ideas are born in conversation.
- Theorize. And if someone gives you a theory? Test it.
- Write. Science is always a collective effort — and writing is how your thinking contributes to that. It also helps to learn to communicate thought in a clear and succint way.
Topics I Want to Explore Deeper
The conference gave me more than just a long list of unknown terms — it gave me the overall feeling of the field and possible directions to explore, listening to the variety of what’s been going on for the last years. Here’s what caught my attention:
GRAPHS. “Who is connected to what, and how?”
It is a way to represent things and relationships between them. They help to see patterns that aren’t obvious in a table of data.

It is a Graph view illustrating my notes and their connections in Obsidian app.
Graphs are made of nodes (like individual notes in my example = dots) and edges (connections between them = lines).
Applications:
- Maps and navigation: finding shortest route, fastest route.
- Recommendation systems: “If you liked X, you might like Y.” Because it finds patterns of connections.
- Fraud detection: suspicious money transfers.
Graphs are the best way to analyze relationships.
LLM (Large Language Models). “What do these words mean, or what words should follow?”
These are models trained on huge amounts of text, designed to understand and generate human-like text. My lovely ChatGPT. <3 Turns out, auto-complete in my email (or phone) is powered by a smaller LLM.
Yet, what I’m curious about — is how they come to be? In essence, LLMs are the result of teaching computers to read enormous libraries of text and recognize how ideas and words naturally connect.
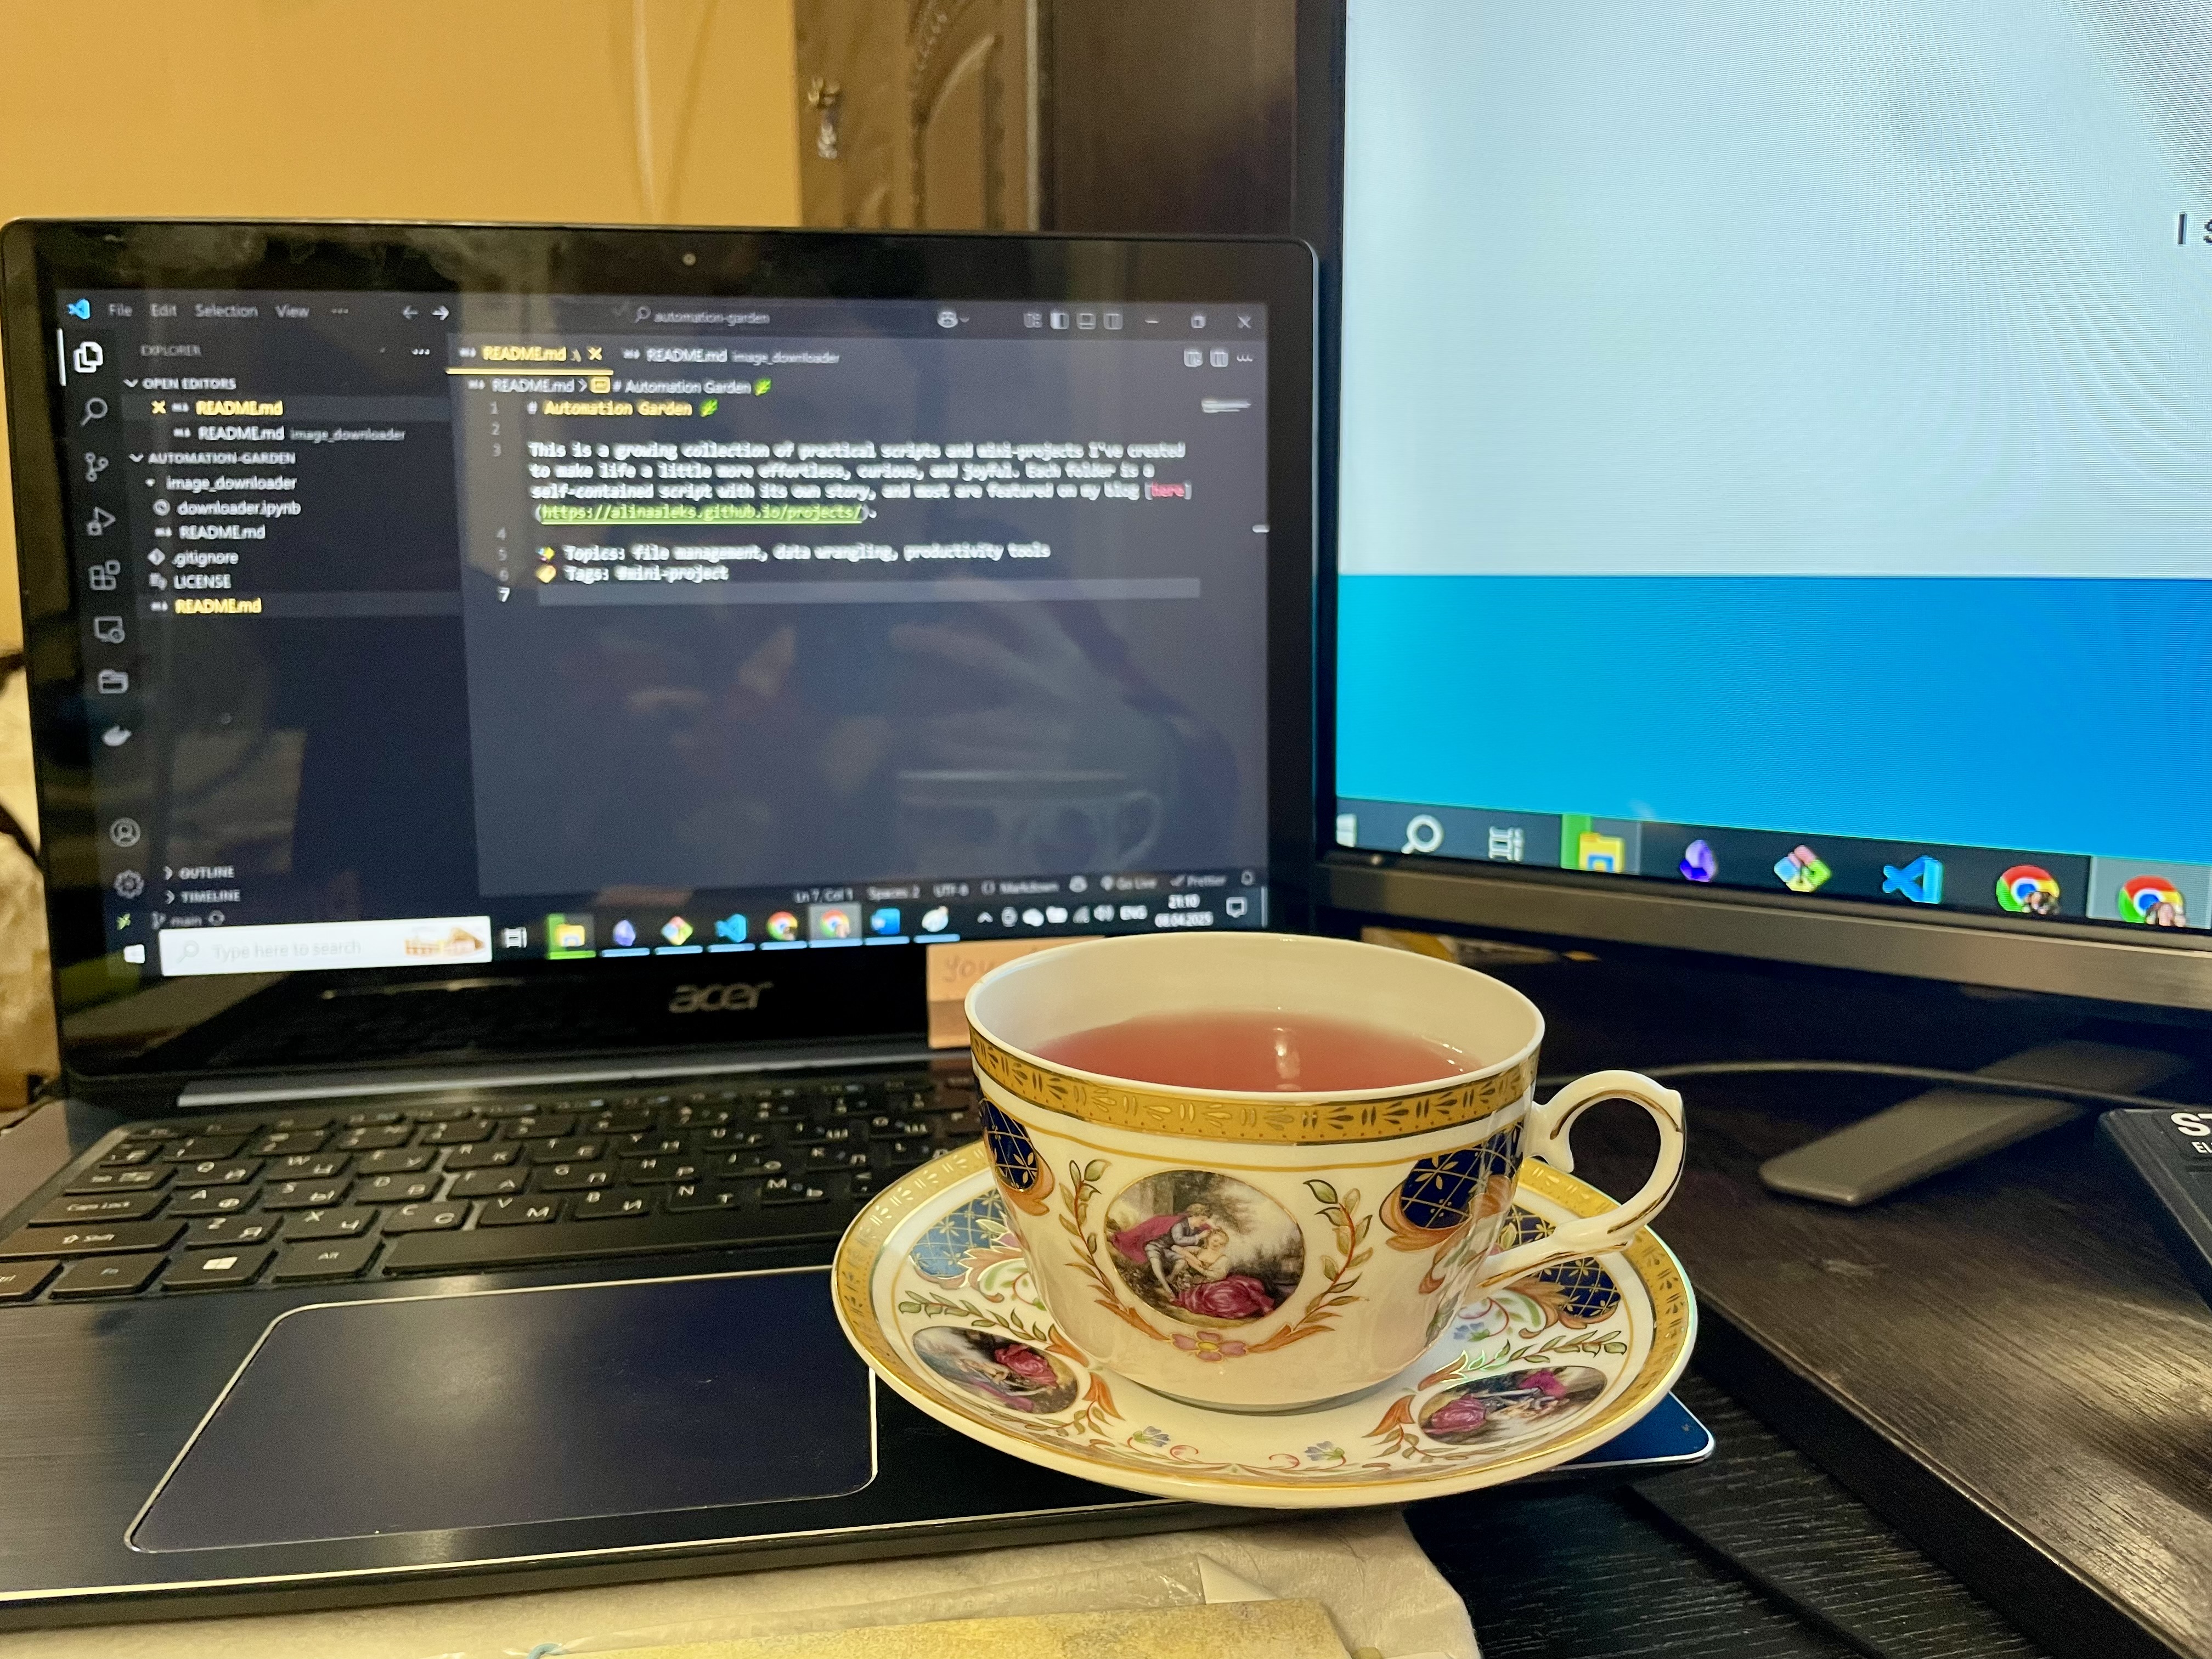
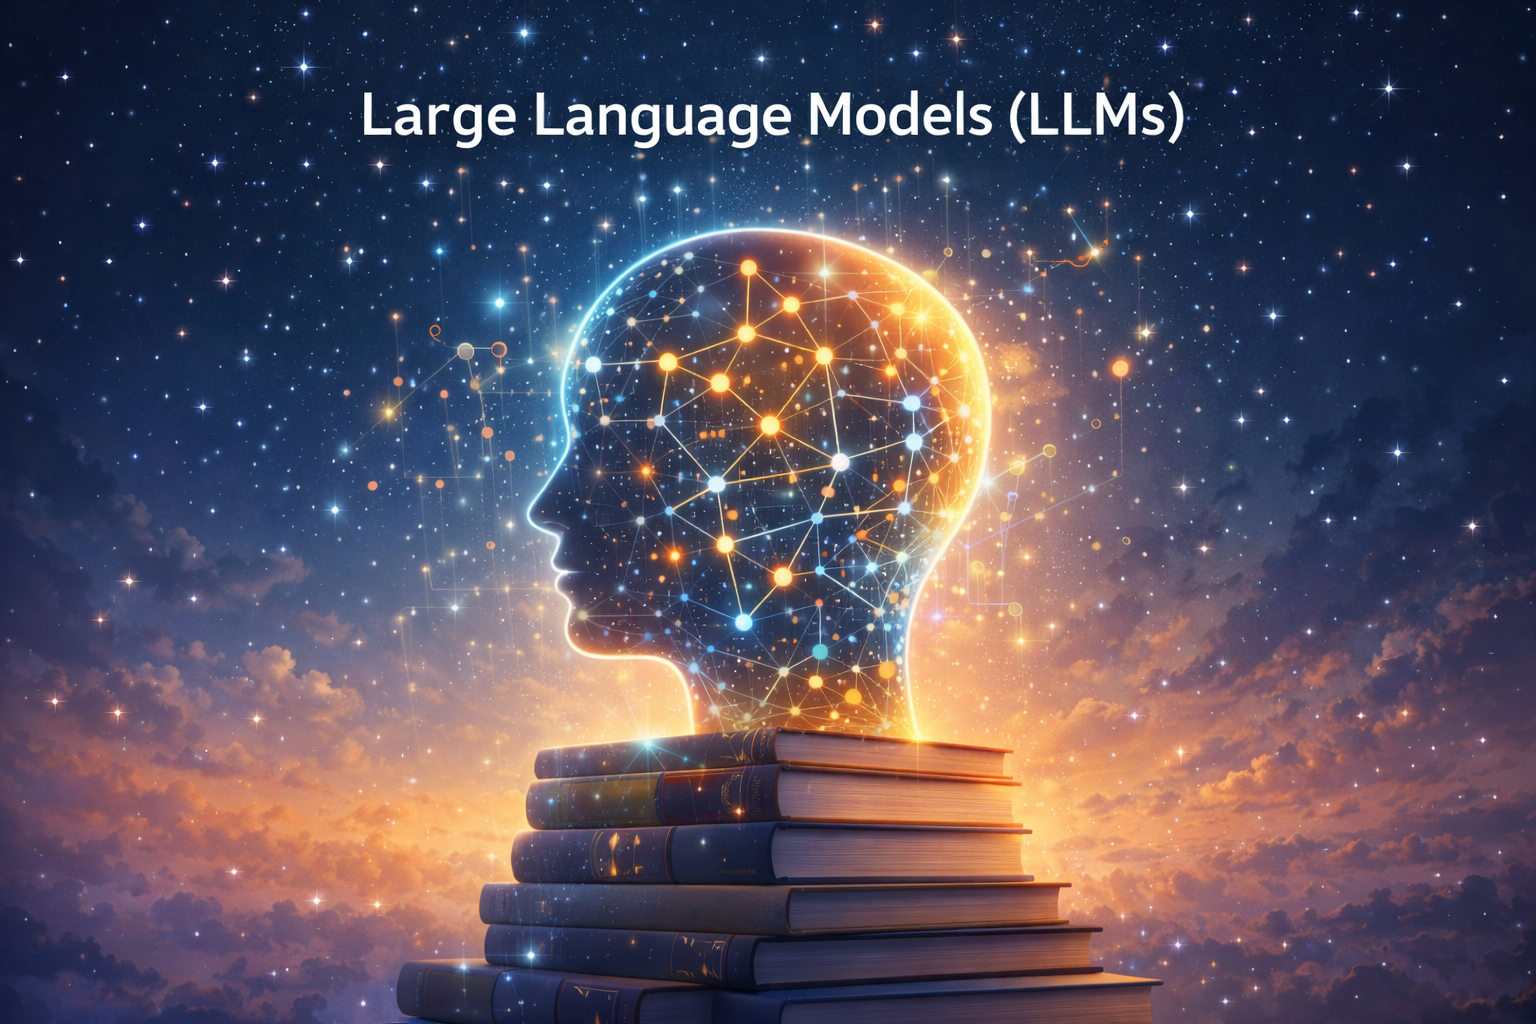
I told ChatGPT that I would like to show him (it? 😬) in my blog post part about LLMs. And asked to generate a lovely image for readers to see. Something related to data and inspiration. I put it as cover.
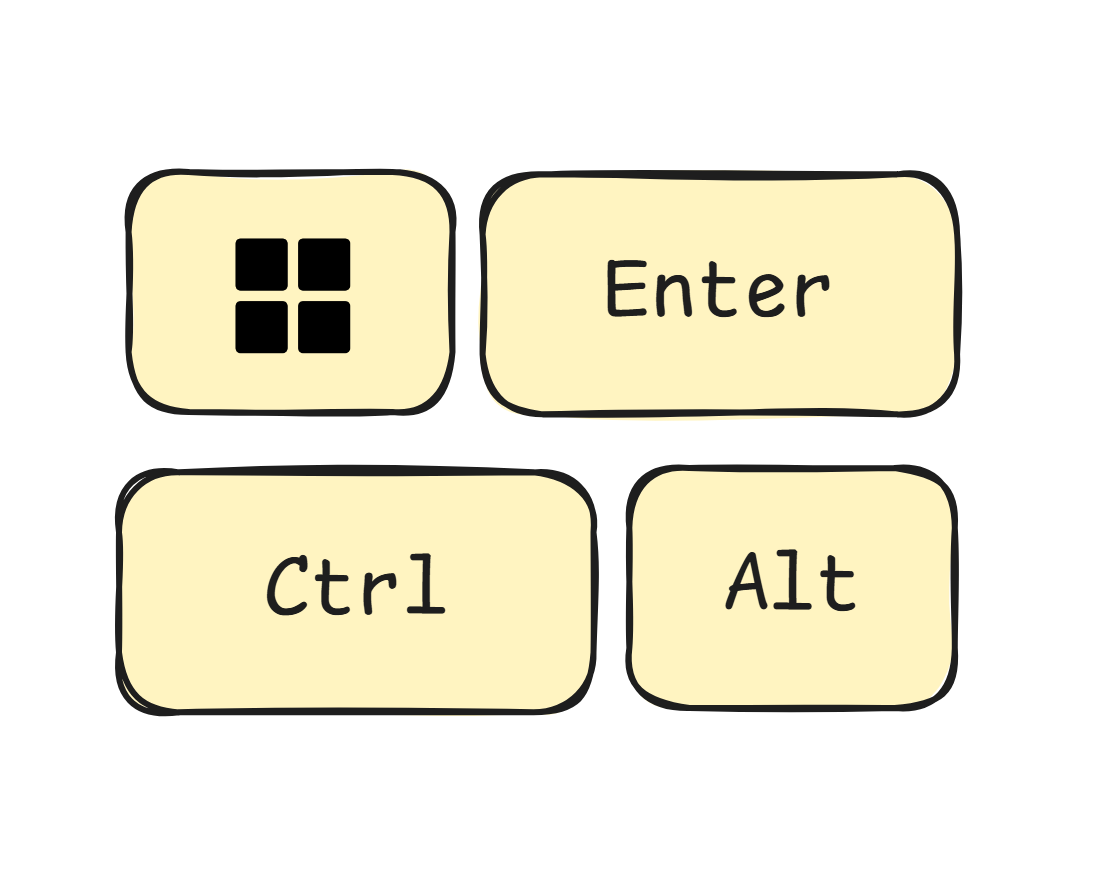
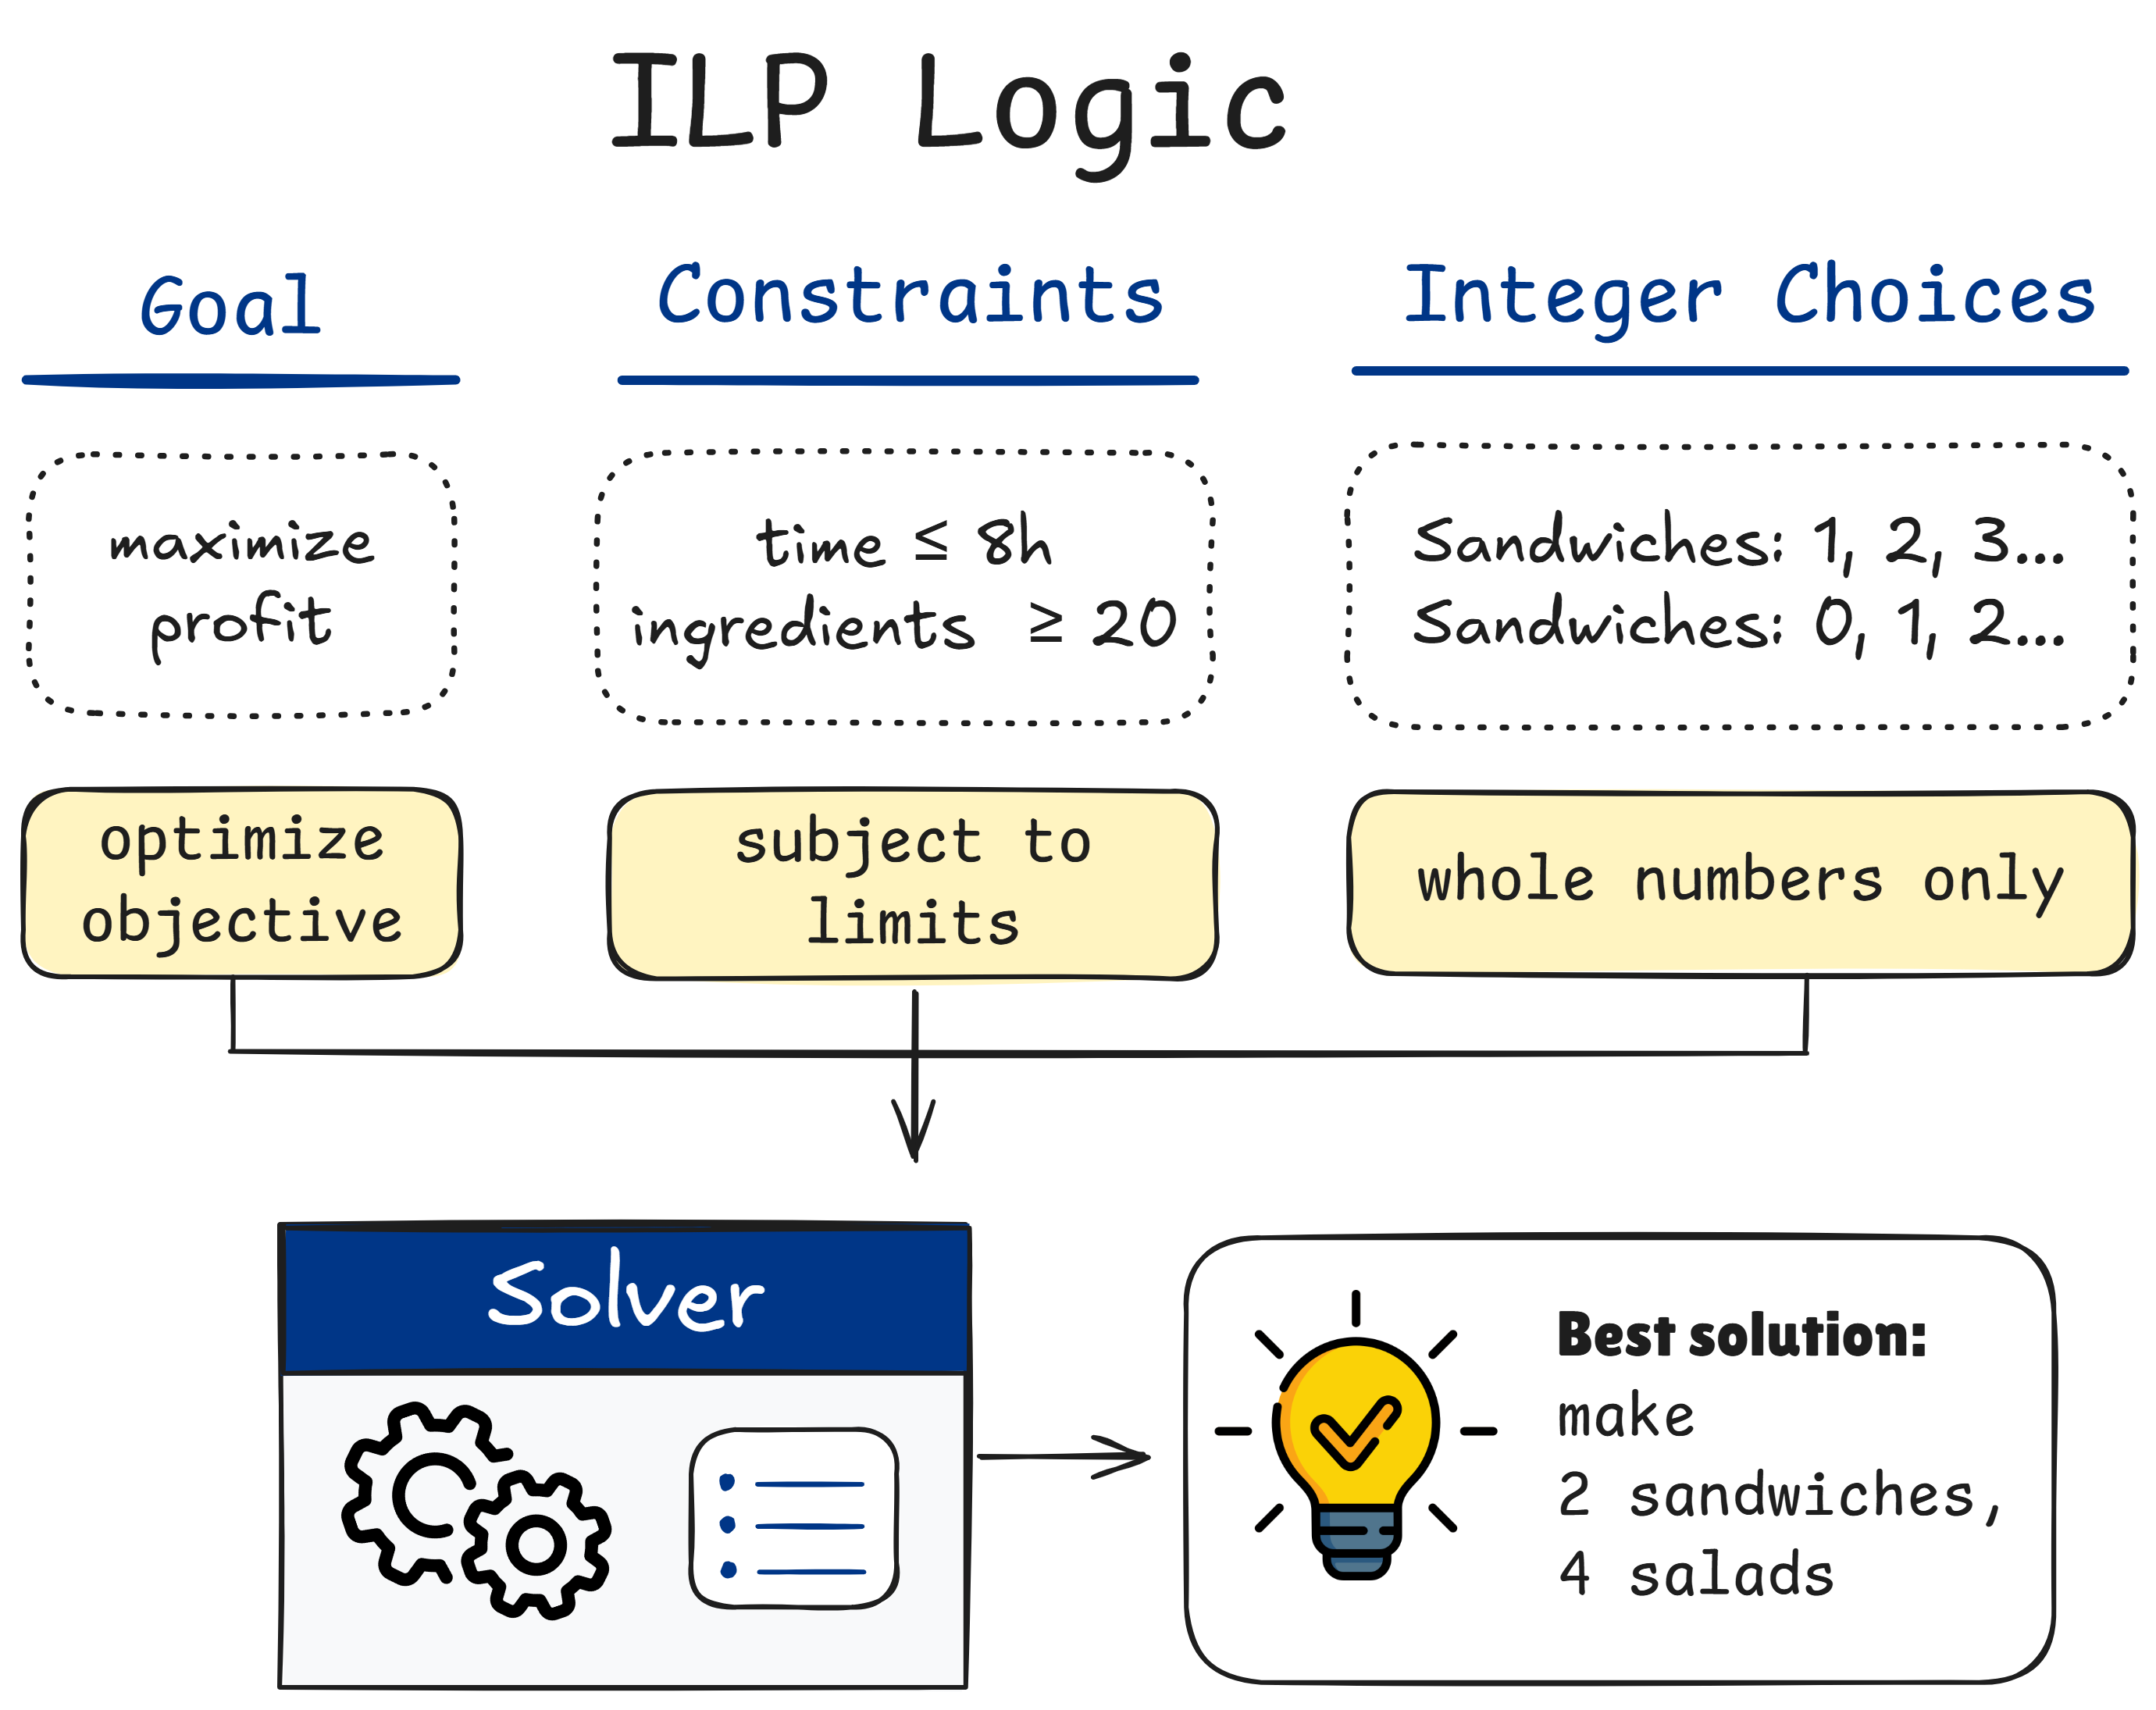
ILP. (Integer Linear Programming). “What is the best choice I can make, given rules and limits?”
I had no idea what this means. But I wanted to find out. Honestly, doesn’t it sound beautiful?
ILP is a mathematical way to solve optimization problems, where you want to maximize or minimize something under certain rules, and where the choices are whole numbers (integers).
I think visual conveys it better.
Applications:
- Scheduling: assigning workers to shifts without overlaps.
- Route optimization: planning delivery routes efficiently.
- Resource allocation: deciding how many of each product to make with limited materials.
All in all, I got to see really intelligent people who speak about all this stuff, understand it and can apply. Isn’t it amazing?! :)